Network Rail is the owner and infrastructure manager for most of the rail network in UK. They have been operating a real time data feed for quite a long time, but the feed was pretty much limited to the train operating companies (TOC's). In recent years however they have also made available a public feed of this data inline with the UK government's Open Data initiatives.
The public feed is available over several protocols which includes a modern HTTP based REST service as well as the much older STOMP base messaging service which is still the one widely used by much of the TOC's themselves.
I have been playing around with data streaming for a while now, but its all been the usual suspects like your social media feeds such as Twitter, Facebook, Instagram, ext, ext.. I was looking for something more interesting and remembered the network rail real time feeds. After looking more closely at the options available I decided to use the STOMP based feed as I was a bit more familiar with this datasets having previously worked with them. Anyone can gain access to this data by first registering on the Network Rail data feed website. There is however a limit to the number of users they register which is revised frequently based on demand and capacity. I have listed all the relevant links to their sites within this article, so you can also check it out if you are interested.
My main goal here is to document and demonstrate the work involved in gaining access to the live feed and establishing a data streaming service utilising Azure Event Hubs and Spark Structured Streaming on Databricks. In order to crystallise this I have depicted the basic tech stack architecture in the diagram below:
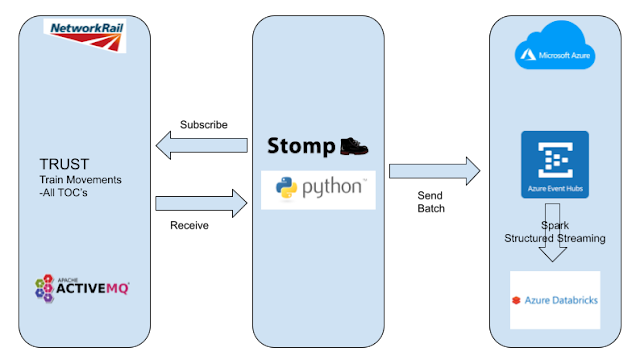
As seen in the above diagram, Network Rail real-time data feed is sourced from an internal enterprise system named TRUST which is used for monitoring the progress of trains and tracking delays on the rail network. There are a number of datasets available from TRUST which you have to select when you register for the data feeds. For this piece of work I have chosen the Train Movements dataset. This dataset consists of a number of topics exposed via an ActiveMQ messaging service that registered users can subscribe to using a client app over the Stomp protocol. Once subscribed, you receive JSON messages that can be sent to an Azure Event Hub in small batches where they can be consumed by Spark Structured Streaming data frames running on Azure Databricks. The train movement data can be put to good use in a large number of monitoring, alerting and analytical applications. In this instance I have decided to use the data to produce a simple streaming dataset that provides for a specific train company information about the number of trains that were on time, late or even early within a 10 minute rolling time window. Of course you could use the data for far more complex and more useful applications, but the objective here is to understand and highlight the basic technicalities involved in doing such a project.
Getting the Source Data
There is a good deal of information about the Network Rail data online if you are interested in the subject of rail operations in the UK. Getting access to the real time data feed is done by first registering on their site which is https://datafeeds.networkrail.co.uk/ntrod/login. Once registered you can select the datasets you are interested in.
Information about the registration process can be found here:
https://www.networkrail.co.uk/who-we-are/transparency-and-ethics/transparency/open-data-feeds/,
Information about the datasets and topics can be found in their Wiki pages here:
https://wiki.openraildata.com/index.php/Main_Page
The Client App
The client app itself can be a simple background job running on an on-premise or cloud server and can be written in any language that supports the Stomp protocol either natively or via third party libraries. For this purpose I have written a small console app in Python using the open source Python Stomp library available from the Python library index. In addition this app also uses the Python Azure Event Hub library in order to send the data received from the real time feed to the Azure Event Hub.
Below is the Python code for this client app in its most simplistic form:
 1
 2
 3
 4
 5
 6
 7
 8
 9
10
11
12
13
14
15
16
17
18
19
20
21
22
23
24
25
26
27
28
29
30
31
32
33
34
35
36
37
38
39
40
41
42
43
44
45
46
47
48 | import stomp
from azure.eventhub import EventHubProducerClient, EventData
NETWORK_RAIL_AUTH = ("<network rail login name>", "<password>")
class Listener(object):
def __init__(self, mq, pr, eb):
self._mq = mq
self._pr = pr
self._eb = eb
def on_message(self, headers, message):
print(message)
try:
self._eb.add(EventData(message))
except ValueError:
self._pr.send_batch(self._eb)
self._eb = self._pr.create_batch()
self._mq.ack(id=headers['message-id'], subscription=headers['subscription'])
def main():
producer = EventHubProducerClient.from_connection_string(conn_str="<event hub namespace connection string>", eventhub_name="<event hub name")
event_data_batch = producer.create_batch()
mq = stomp.Connection(host_and_ports=[('datafeeds.networkrail.co.uk', 61618)],
keepalive=True,
vhost='datafeeds.networkrail.co.uk',
heartbeats=(100000, 50000))
mq.set_listener('', Listener(mq, producer, event_data_batch))
mq.connect(username=NETWORK_RAIL_AUTH[0],
passcode=NETWORK_RAIL_AUTH[1],
wait=True)
mq.subscribe('/topic/TRAIN_MVT_ALL_TOC', 'tmat-1', ack='client-individual')
input('press any key to stop')
mq.unsubscribe('tmat-1')
mq.disconnect()
producer.close()
print('connection closed')
if __name__ == "__main__":
main()
|
The credentials in line 4 should be replaced with the login name and password that was used to register for the live feeds.
The <event hub namespace connection string> in line 27 should be replaced with the correct connection string for the Azure Event Hub Namespace. Also the <event hub name> should be replaced with the name of the Event Hub Instance. These details are available on the Azure portal once the event hub has been provisioned on the relevant Azure subscription. I have further explanations regarding the event hubs in the following sections of this article.
In the above code, lines 1 and 2 brings in the Stomp library and Azure Event Hub library which are the only external Python libraries required for this basic app.
In line 6 we setup a Listener class which has the job of listening to the messages arriving from the subscribed live feed. This class takes in as parameters a Stomp connection object, an Azure Event Hub producer object, and an Azure Event Hub data batch object. At the heart of this class is the 'on_message' method in line 13 which gets called by Stomp listener with each message that it receives. It then attempts to add those messages to the event hub data batch object in line 18. This continues to happen until the total size of all the received messages exceed the size limit of the event hub data batch at which point it enters the exception defined in line 20. The exception handler then sends the event hub data batch object containing the data so far collected to the Azure Event Hub in line 21. Line 22 then replenishes the data batch object with a new instance to resume the process of collecting new messages again.
In the main function, lines 27 and 28 sets up the connection to the Azure Event Hub from the information obtained from the provisioned resources. Line 30 makes the connection to the message queue over Stomp. Note the parameters being passed here pertain to the host ActiveMQ server at Network Rail along with the relevant port enabled for the connection. This information can be obtained from the Wiki pages given earlier. Additionally the heartbeat parameter is optional but is encouraged to make the connection more efficient and fault tolerant. More information about this along with the documentation on the Python Stomp library is available on this link: https://github.com/jasonrbriggs/stomp.py
An instance of the Listener class defined earlier gets assigned to the Stomp connection in line 34 before the actual connection is made in line 35 using the credentials provided at the start in line 4.
The listener starts in line 39, when a subscribe is made on the Stomp connection to the message queue. Notice that the first string parameter is the path to topic which in this case is TRAIN_MVT_ALL_TOC. This is the codified topic name for 'Train Movements -All TOC's' dataset available on the Network Rail data feeds. If another dataset is required, then further subscribes could be made by finding out their codified topic names from the Network Rail Open Data Wiki page links given earlier. Since it is possible to have multiple subscribes on the same Stomp connection, the second string parameter takes a unique identifier that can be used to reference them in subsequent actions such as unsubscribes as can be seen in line 42.
This simple client app runs as a console application and once started will continue to run printing each message as they are received until the user terminated the app by hitting any key. Note that this app is written this way for simplicity and ease of explanations and is not a production ready app. Typically this would be run as a background service job with additional logging, exception handling, fault tolerance and performance characteristics built in.
For demonstration purposes I am simply printing the received messages to the console in line 15 before sending them to the event hub. The clip below shows how this app is receiving data from the Network Rail real time feed in a VS Code terminal.
Azure Event Hub
Azure Event Hubs are based on the same underlying platform as Azure Service Bus. However event hubs are geared more towards ingesting and handling big data streams. Hence this is the perfect service to ingest the real time feeds from Network Rail. All that is needed is to provision one on a Azure subscription. This is a fairly straight forward process which could be done via a fully automated DevOps process, or for demonstration and learning purposes simply creating one on the Azure portal.
For details on how to provision an Azure Event Hub, see the link below:
https://docs.microsoft.com/en-us/azure/event-hubs/event-hubs-create
Once the event hub and instance have been created, the Primary Key Connection Strings of both the event hub namespace and the event hub instance should be noted along with the name of the instance. These pieces of information can be easily obtained from the Azure portal under the provisioned event hub. They are needed when writing and/or configuring the client app that sends data to the event hub and the Databricks notebook that consumes the data streams ingested from the event hub.
Azure Databricks
Azure Databricks is essentially Spark provisioned on the Azure platform. Spark offers Structured Streaming based on dataframes which is ideal for the performance analytics that we need to build here. Similar to Azure Event Hubs, provisioning an Azure Databricks cluster can be done in a automated manner using DevOps or by simply using the Azure Portal.
For details on Azure Databricks and how to provision clusters can be found on the link below:
https://docs.microsoft.com/en-us/azure/databricks/clusters/
Databricks notebook for real time TOC performance analysis
For the purpose of conducting this simple performance analysis, I set up a Databricks notebook on the portal under an existing workspace.
See the link below for more details on how to setup workspaces and notebooks:
https://docs.microsoft.com/en-us/azure/databricks/workspace/
Databricks notebooks supports Python, Scala, SQL and R languages. I have used Python for this notebook along with the build in PySpark library. Here we can consume the data being ingested into the Azure Event Hub using a Structured Streaming dataframe.
Before being able to consume data from the event hub, we need to install the Apache Spark Event Hub Connector library package on to the cluster provisioned for the job. To do this on the portal launch into the Databricks workspace and go to the Compute tab where you can see the clusters. Make sure the cluster is up and running, then click on 'Install New' as seen below:
Chose Marven as the Library Source and provide the Coordinates to the package as seen below:
Note it is important to match the package version to the version of the Databricks cluster. To help with this there is a handy table put together by the good folks who created this package which can be found in the link below:
https://github.com/Azure/azure-event-hubs-spark
I have highlighted below the version I have selected from the table below, based on the version of the cluster that I provisioned:
You can get the exact coordinates for the package by clicking on the Package Version above which takes you to the Marven Central Repository. Once the package is installed it will appear listed under the Libraries tab on the cluster page.
With the required library package installed, its time to take a look at the notebook in more detail. Before diving in though its good to get to know the train movement data a bit better. These are essentially the real time event records that reports on the progress of trains along their journey. They include every arrival and departure at a station stop, along with the corresponding timestamps and a variation status that indicate if the event occurred on time, late or early. In addition to this, there are also many other pieces of data that gets embedded in those records providing information on the train operator, location, service, scheduled times, ext., ext.. However for the purpose of this work, only the train operator id, actual timestamp and variation status is needed. From the train operator id, it is possible to obtain the train operator name by referencing a static list in the form of a simple delimited text file which can be uploaded to the Azure storage beforehand.
The table below lists the data that is used for this simple performance analysis:
| Train Movement Feed |
| division_code | Operating company ID as per TOC Codes |
| actual_timestamp | The date and time that this event happened at the location |
| variation_status | One of "ON TIME", "EARLY", "LATE" or "OFF ROUTE" |
| Static Reference for TOC names |
| Sectorcode | Operating company ID as per TOC Codes |
| Description | Name of operating company |
For the purpose of this article and for simplicity, the analysis has been limited to a single TOC. Hence only the single record pertaining to that TOC has been inserted into the static reference file. If other TOC's needs to be included in the analysis then its simply a matter of inserting the records for those in the reference file.
In the first cell of the notebook we configure the Spark Context to allow access to the Azure Storage Account so that it can retrieve the TOC codes and names from the static reference file. We also setup a variable to hold the connection string to the Azure Event Hub Instance. Note that this connection string is not the same as the one used earlier in the Client App to send data to the event hub. That was the connection string to the event hub namespace whereas this is the connection string to the event hub instance. The code for this cell is shown below:
 1
 2
 3
 4
 5
 6
 7
 8
 9
10
11
12
13
14
15
16
17 | from pyspark.sql.types import *
import pyspark.sql.functions as F
# Set access key credentials to the Azure Data Lake Gen 2 at the Spark Context
spark.conf.set(
"fs.azure.account.key.<azure storage account name>.dfs.core.windows.net",
"<azure storage account access key>")
# Connection string to the Event Hub Instance
conn_str = "<event hub instance connection string>"
# Initialize event hub config dictionary with connectionString
ehConf = {}
ehConf['eventhubs.connectionString'] = conn_str
# Add consumer group to the ehConf dictionary
ehConf['eventhubs.consumerGroup'] = "$Default"
# Encrypt ehConf connectionString property
ehConf['eventhubs.connectionString'] = sc._jvm.org.apache.spark.eventhubs.EventHubsUtils.encrypt(conn_str)
|
First the dependant libraries are imported into the notebook in line 1 and 2.
The string values in line 6 and 7 should be replaced with the Account Name and Access Key to the Azure Storage Account where the static reference file is stored. The Access Key can be obtained from the Azure portal under the provisioned storage account.
The string value in line 10 should be replaced with the connection string to the Azure Event Hub Instance. As mentioned earlier this information can be obtained from the Azure portal under the provisioned event hub instance
In the next cell we can load both the streaming data and static reference data into dataframes:
1
2 | dfstream = spark.readStream.format("eventhubs").options(**ehConf).load()
dfref = spark.read.option("delimiter","\t").csv("abfss://refdata@<storage account name>.dfs.core.windows.net/sectorcodes.csv", header="true")
|
Line 1 loads the real time train movements data feed from the event hub to a streaming dataframe using the configuration information setup in the dictionary variable in cell 1. Line 2 loads the static reference file containing the TOC codes and names into a static dataframe. Note that this is a tab delimited text csv file named 'sectorcodes.csv' stored in a container named 'refdata' in a Azure Storage Account. The string <storage account name> should be replaced with the respective name of the provisioned storage account.
Next we define the schema that maps to the JSON structure of the messages received from the Network Rail data feed. This is a crucial piece to get right without which the data would not be usable. Fortunately the Network Rail data feed messages are not hugely complex and can be handled with the schema shown in the following cell:
 1
 2
 3
 4
 5
 6
 7
 8
 9
10
11
12
13
14
15
16
17
18
19
20
21
22
23
24
25
26
27
28
29
30
31
32
33
34
35
36
37
38
39
40
41
42
43 | sch = ArrayType(
StructType([
StructField("header",StructType([
StructField("msg_queue_timestamp",StringType(),True),
StructField("msg_type",StringType(),True),
StructField("original_data_source",StringType(),True),
StructField("source_dev_id",StringType(),True),
StructField("source_system_id",StringType(),True),
StructField("user_id",StringType(),True)
])),
StructField("body",StructType([
StructField("actual_timestamp",StringType(),True),
StructField("auto_expected",StringType(),True),
StructField("correction_ind",StringType(),True),
StructField("current_train_id",StringType(),True),
StructField("delay_monitoring_point",StringType(),True),
StructField("direction_ind",StringType(),True),
StructField("division_code",StringType(),True),
StructField("event_source",StringType(),True),
StructField("event_type",StringType(),True),
StructField("gbtt_timestamp",StringType(),True),
StructField("line_ind",StringType(),True),
StructField("loc_stanox",StringType(),True),
StructField("next_report_run_time",StringType(),True),
StructField("next_report_stanox",StringType(),True),
StructField("offroute_ind",StringType(),True),
StructField("original_loc_stanox",StringType(),True),
StructField("original_loc_timestamp",StringType(),True),
StructField("planned_event_type",StringType(),True),
StructField("planned_timestamp",StringType(),True),
StructField("platform",StringType(),True),
StructField("reporting_stanox",StringType(),True),
StructField("route",StringType(),True),
StructField("timetable_variation",StringType(),True),
StructField("toc_id",StringType(),True),
StructField("train_file_address",StringType(),True),
StructField("train_id",StringType(),True),
StructField("train_service_code",StringType(),True),
StructField("train_terminated",StringType(),True),
StructField("variation_status",StringType(),True)
]))
])
)
|
As can be seen in the code above, schema is a array of structures each element comprising of 2 nested field structures, one called 'header' and another called 'body'. As discussed earlier although we schematise and map the entire message structure, only a small number of fields from the body is used for our analysis. With this schema in place we can actually convert the JSON messages into usable dataframes and run the required analysis in the next cell as shown below:
1
2
3
4
5
6
7 | dfsj = dfstream.select(F.from_json(F.col("body").cast("string"), sch).alias("payload"))
dfsjrows = dfsj.select(F.explode(dfsj.payload))
dfevtoc = dfsjrows.join(dfref, dfsjrows.col.body.toc_id == dfref.Sectorcode)\
.withColumn("event_time", F.to_timestamp(F.from_unixtime((dfsjrows.col.body.actual_timestamp.cast("double"))/1000)))
dftocperf = dfevtoc.withWatermark("event_time", "30 minutes")\
.groupBy(F.window(F.col("event_time"), "10 minutes", "5 minutes"), "Description",dfevtoc.col.body.variation_status).count()\
.orderBy("Description","window")
|
Note that the messages arriving from the event hub are in binary form and needs to the converted to string to reveal the JSON contained within. Only then can the schema defined earlier could be applied to the JSON to convert them to a dataframe. These steps can all be easily done in a single statement as seen in line 1.
Since each JSON message is an array nested elements, they need to be exploded into individual train movement records. This steps happens in line 2.
In line 3, we join the explored train movement records with the TOC code reference data to being in the TOC names. The statement in line 3 is chained to derive a new column that is a conversion of the actual timestamp from unix time to regular datetime. Note that this is required due to the fact that all time fields from the Network Rail data feed arrives in unix time.
Finally in line 5 we create the analysis dataframe by calculating the count of train movement events grouped by a time window, TOC name and the variation status. Notice that the count is based on a 10 minute rolling time window with a the count being updated every 5 minutes. An optional watermark time of 30 minutes is also applied to prevent a memory overrun as this demonstration notebook is only meant to be run on limited resources. The resulting dataframe also gets ordered by TOC name and the time window. Note that the grouping by time window is not of any value for the analysis, but its only present here to demonstrate the frequency of the real time data as they arrive into the streaming dataframe.
To learn more about aggregations on streaming dataframes along with time windows and watermarks, refer to the documentation at Databricks in following link:
https://databricks.com/blog/2017/05/08/event-time-aggregation-watermarking-apache-sparks-structured-streaming.html
As long as the client app is sending data from real time data feed to the event hub and the event hub is streaming to Databricks ,the final dataframe will continue to aggregate as per specified fields and time windows. The dataframe can be used in many different ways depending on the requirement. i.e. It could be written to a database for further processing, It could be written back to another event hub for further onward streaming and directly consumed by a dashboard on Power BI or any other thin client or rich client app.
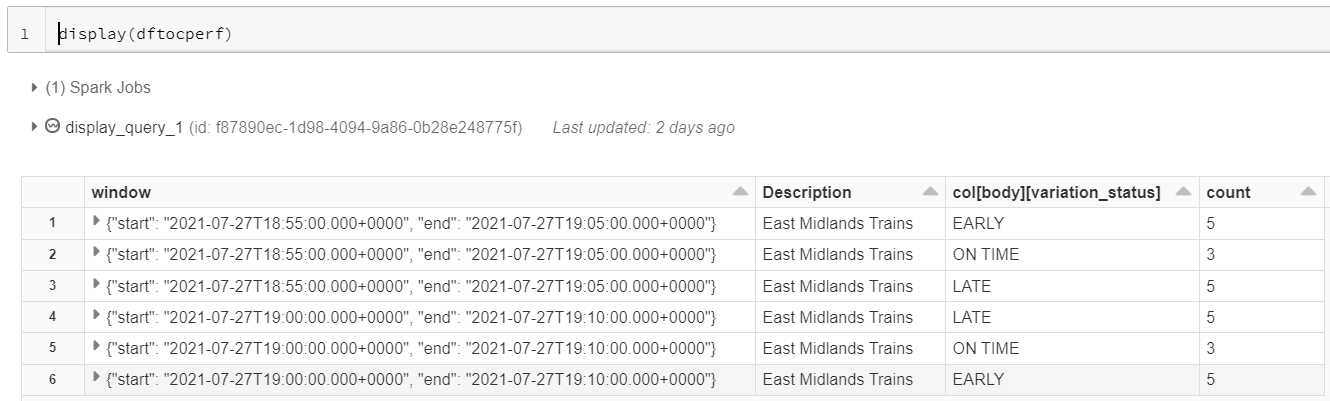
However on this notebook, for demonstration purposes, we can simply display the final dataframe using the Databricks display statement as shown below:
As mentioned earlier, the window column has been included in the aggregation here to demonstrate the frequency of the rolling time window within which the train movement events are being counted. The description column referees to the TOC name which has been referenced from the static reference file containing TOC codes and names. The variation status column is displayed by its fully qualified dataframe path.
The final analysis could of course be further refined, although my objective here was to document and demonstrate the work involved in building a basic data streaming service over this tech stack.